
For the past several nights I’ve been working on putting my academic data analytics and visualization skills to practice, by creating a website that will interact with a given data set, report on included and calculated relationships, and then have the end-user customize and drill-down the information to their specific interests.
Because I’m a giant nerd I took as a starting point the wealth of information that is available in the post-match replays of Heroes of the Storm games, particularly ones in which I and my friends took part. I was able to get the raw data by querying an API, which gave me a lot of data, but not information that was easily communicated or digested. While the source of information and intended audience may be rather niche, this exercise proved very valuable as an exercise in not only deciding what to show, but also how. I often refer back to an adage I took to heart as I first started studying data analytics, and it holds true whether talking about Q3 financials in front of the CEO or discussing game events among friends.
Data must drive action.
I think it’s easy to throw statistics and figures at people, an endless barrage of charts, graphs, and analyses, pulled from all corners of daily life. What’s important is determining which information is most relevant to the presentation audience’s needs, and how that data can or hopefully will encourage change. At work I took a monster 35-slide presentation and dropped it to two slides and four bullet points. Not only was the message clear and concise, I didn’t lose the audience’s attention by going through all of the back-end data that helped me come to my conclusions; it just wasn’t relevant to the conversation at hand.
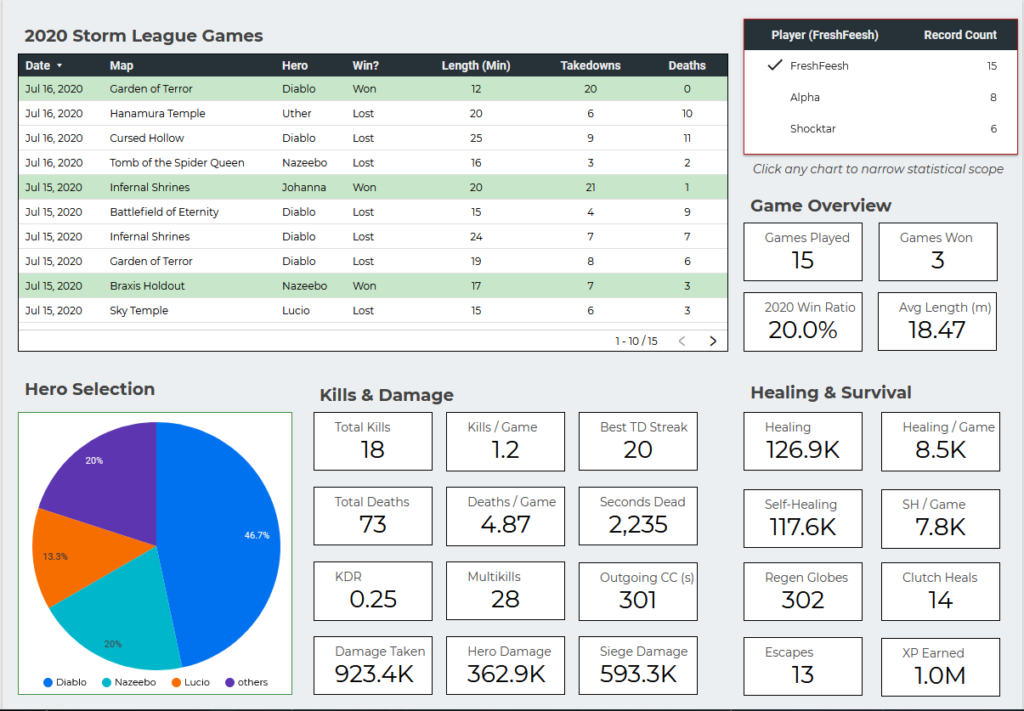
So bringing myself back to the silly website I made for my HOTS teammates, which you can find by clicking the snapshot here, I had to figure out what I wanted the information to convey—its story, if you will—and what action I wanted to drive. I’m passingly familiar with a number of data visualization tools such as Microsoft’s PowerBI, Tableau, ClicData, and a few others, but I was drawn to Google’s Data Studio, primarily for the ease with which it integrated with my data sources; just a few clicks and I was up and running.
Each year of competitive HOTS play is split into “seasons,” and with the current season my friends and I have found that we aren’t playing as competently or efficiently as we want. For the past almost two years we’ve been playing unranked or other game modes, so perhaps we were just rusty in this particular format, or perhaps the game had changed or evolved beyond what we were used to. To figure out how to improve, I wanted to see how we were faring at our core competencies, and to try to identify patterns that should either be strengthened or corrected. This included the amount of damage done to various targets, the specific characters we were playing, and how we fared on different maps, or over time.
Honestly most of the information will be beyond the interest of most non-competitive-gamers, but I feel it shows just how much data is available about even this most mundane of hobbies; some of the information I found isn’t even normally accessible to the players themselves, such as in post-match summaries or player profiles. I wanted to highlight a number of those elements as well, to try and capture some measure of the more intangible or esoteric aspects of the game.
I’ve previously written on the value of APIs in gaming, and how I wish that more companies would realize the kind of user engagement they could get if they opened some data for player perusal and analysis. Surprisingly Blizzard has not opened any sort of official API for Heroes of the Storm, but many players have come together to write programs that will analyze the game replay files that Blizzard does provide, and use that to build robust databases of match data, which can be accessed via API.
I was posting about my progress in creating this website to a gaming group and someone asked me to dive into my process of reading API information and composing all of the boxes, widgets, and charts that make up the meat of its presentation. Much of what I explained made it into this post, but exactly what an API is didn’t, so I’ll quote myself here:
Basically many game companies give players the ability to read gameplay data, either in real-time or after a certain delay. This allows 3rd party (user-made) programs to read information from the game world and adjust accordingly. Think of online armour wardrobes, guild stat pages, and so forth. These all read information from the game servers and display it in a new and (hopefully) interesting way that is of value to their users. At its core, that’s the use of a read-only API.
Read-write APIs also exist, which can be used to give commands to software from an external source, but that was a bit beyond the scope of our late-night conversation. In any case, it was a blast trying to come up with not only the sensible data I wanted to display but also the logical and technological ways to make it happen; working with chart dimensions and metrics, and slowly figuring my way through their differences, was a new experience which went much deeper than the topical exploration I did when I first looked at visualization software for my workplace last Winter. Putting this site together and making it behave as I thought it should was difficult, sometimes frustrating, but ultimately very rewarding.
There’s a quote by Peter Mayle I keep on my phone and think about often. While he was speaking specifically to authors, I think the same advice applies to any creative endeavor:
[The] best advice on writing I’ve ever received: finish.
Not only does it mean to “finish what you’ve started,” but also “know when to stop.” I could keep tinkering on this API-driven website for ages, tweaking and adjusting, making changes that would ultimately only matter to me. I have to take a step back, take a long look at what I’ve accomplished, and say it’s done. I did the same with my first novel, and while this wasn’t nearly the same kind or amount of labor—emotional or otherwise—it feels very good to say I’m finished with this project, and that the end result both applies to my casual hobbies as well as my professional interests.
Here’s a direct link to my labor of love, if you’re interested in checking it out. If you or someone you know plays an online game and may be interested in something similar, please by all means reach out to me! I love working on small projects like this.
Header image by Mudassar Iqbal, posted on Pixabay


